Terreno Rústico Observability Platform
A production-grade, secure, self-hosted containerized telemetry stack engineered with Prometheus, Loki, Promtail, Node Exporter, cAdvisor, and Grafana behind Traefik TLS.
⚡ Self-Hosted Telemetry Stack (V1 Baseline)
The telemetry and infrastructure monitoring setup for Terreno Rústico. Engineered to deliver sub-second metrics scraping, zero-friction log aggregation, and real-time alerts without exposing private infrastructure data.
ℹ️ Initial V1 Architecture Note
This setup represents an initial v1 prototype of our monitoring environment. It serves as the baseline for our upcoming production observability stack, which will incorporate expanded metrics, distributed tracing, automated alert routing, and continuous resilience improvements.
Overview: High-Availability Telemetry
When processing large-scale geospatial datasets—such as Cadastral UTM parcel geometries, PostGIS spatial intersections, and SIGPAC agricultural data—system visibility is critical. A single unindexed database query or unexpected CPU spike during peak traffic can degrade map rendering performance.
To guarantee maximum availability and sub-second API response times for Terreno Rústico, we designed and deployed a self-hosted, cloud-native monitoring platform as an initial v1 baseline.
This project blueprint breaks down our initial telemetry architecture so the developer community can replicate and deploy a similar foundation.
Live System Dashboards & Metrics Snapshot
Below are detailed snapshots of our Grafana dashboard panels monitoring host resources, PostgreSQL/PostGIS transactions, and NestJS API event loop latency:
1. Database & Infrastructure Performance
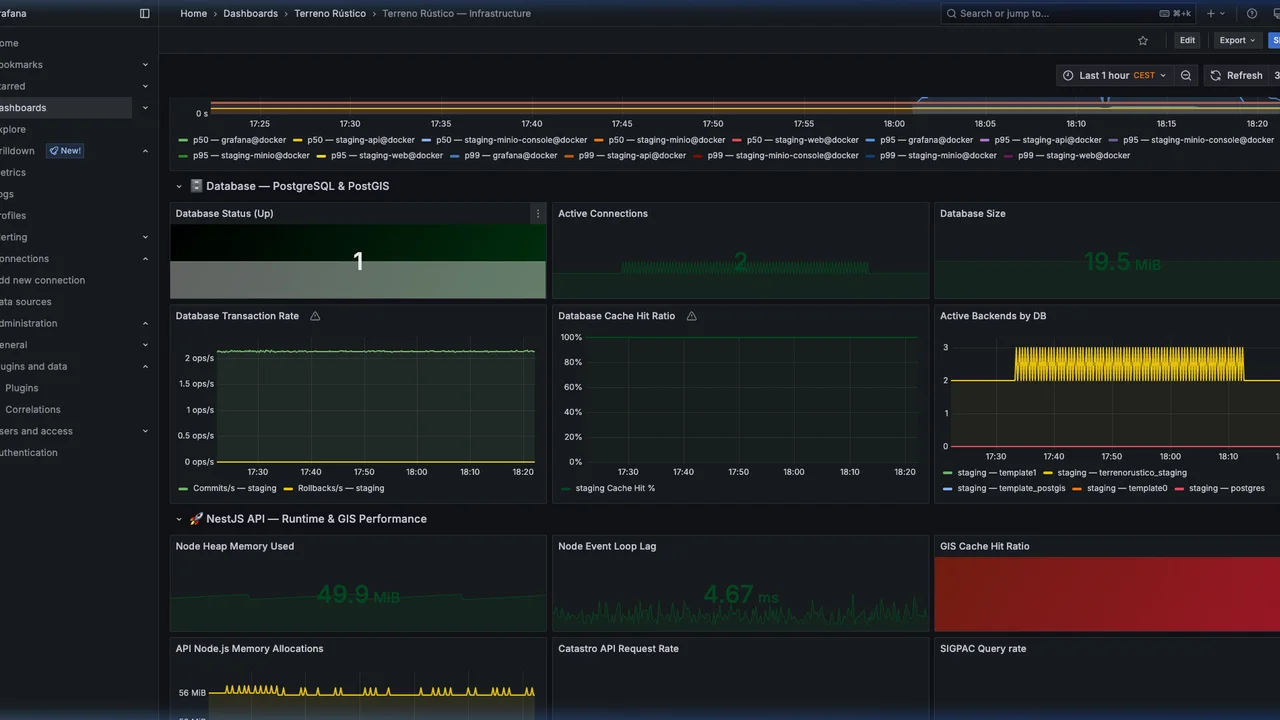
Key metrics tracked:
- PostgreSQL Status & Active Connections: Instant visibility into active database sessions and pool sizes.
- Database Transaction & Commit Rate: Real-time transaction throughput and commit/rollback velocity.
- Cache Hit Ratio: Ensuring 100% cache hit rates for frequently accessed geospatial queries.
2. NestJS API & GIS Engine Runtime
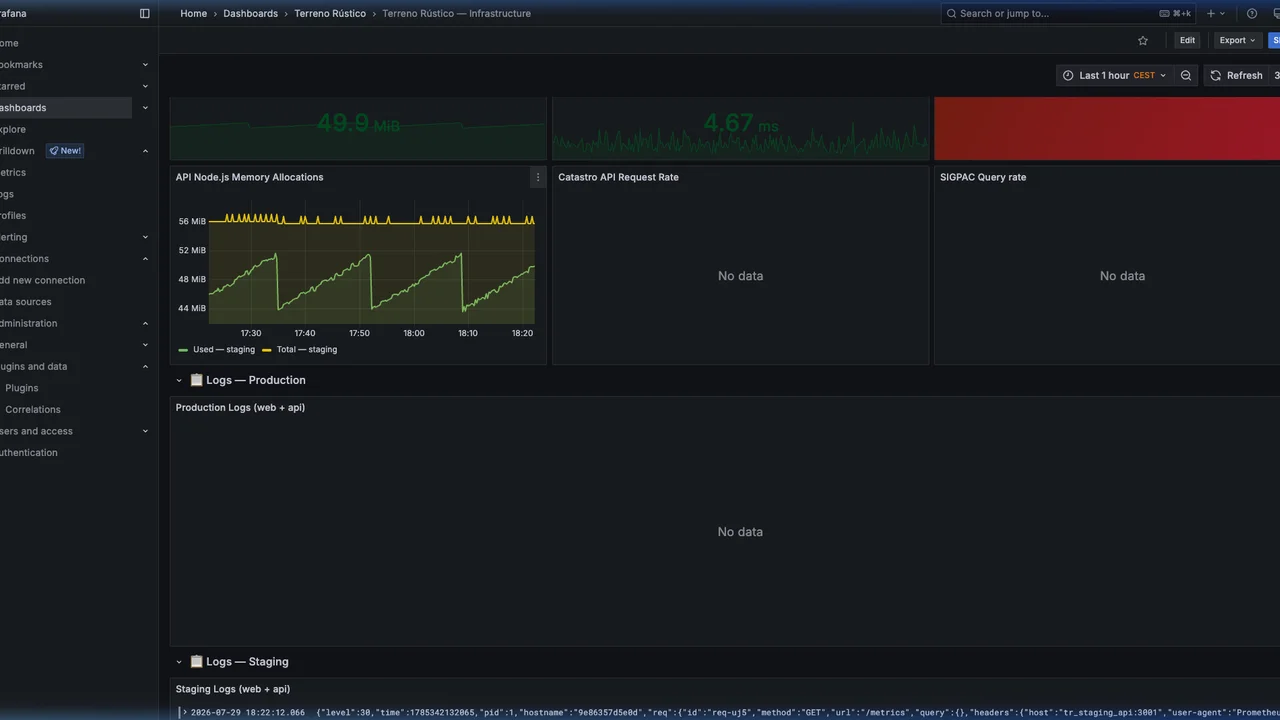
Key metrics tracked:
- Node Heap Memory Allocation: Tracking active heap allocations to eliminate memory leaks.
- Event Loop Lag: Monitoring Node.js event loop delay (consistently below 5ms).
- Cadastro & SIGPAC API Request Rates: Monitoring upstream spatial API request rates and failure percentages.
System Architecture & Data Flow
Our monitoring platform collects metrics and log streams across host OS nodes and isolated Docker containers using a secure, zero-trust network model:
graph TD
    subgraph Host Node & Containers
        NE["Node Exporter<br/>(OS Metrics)"]
        CA["cAdvisor<br/>(Container Metrics)"]
        CL["Docker Containers<br/>(JSON Logs)"]
    end

    subgraph Monitoring Internal Network
        PROM["Prometheus TSDB<br/>(Port 9090)"]
        LOKI["Grafana Loki<br/>(Port 3100)"]
        PT["Promtail Log Collector"]
    end

    subgraph Public Edge
        TR["Traefik Reverse Proxy<br/>(Let's Encrypt TLS)"]
        GF["Grafana UI<br/>(Secured Endpoint)"]
    end

    NE -->|Scraped by| PROM
    CA -->|Scraped by| PROM
    CL -->|Read by| PT
    PT -->|Pushes logs| LOKI

    PROM -->|Data Source| GF
    LOKI -->|Data Source| GF

    TR -->|HTTPS / Port 443| GF
    User["DevOps & Engineering Team"] -->|Secure Login| TR
Core Components
1. Prometheus (Metrics Engine)
- Serves as the central Time Series Database (TSDB).
- Scrapes system endpoints every 15 seconds.
- Retains metrics data for 30 days up to a 5GB storage cap.
2. Node Exporter & cAdvisor
- Node Exporter: Captures physical CPU, RAM, disk I/O, and network stats from the host OS.
- cAdvisor: Auto-discovers running Docker containers and measures per-container CPU throttling, memory limits, and network throughput.
3. Grafana Loki & Promtail (Log Stream Engine)
- Promtail: Ships Docker log streams directly from
/var/lib/docker/containersto Loki. - Loki: Index-free log aggregation system indexing metadata labels (
container_name,log_level), keeping memory overhead extremely low compared to Elasticsearch.
4. Grafana Dashboard UI
- Unified dashboard for real-time visualization and alerting.
- Monitored metrics include HTTP response latency percentiles (p50, p95, p99), PostGIS query execution times, container restart rates, and system load averages.
Security Infrastructure
- Network Decoupling: All internal telemetry services (Prometheus, Loki, Promtail) run strictly inside a private Docker bridge network (
monitoring-internal). No metrics ports are published to the public internet. - TLS Gateway: Public access to Grafana is handled exclusively through Traefik over TLS 1.3 with automatic Let’s Encrypt certificates and HSTS security headers.
- Restricted Signups: Anonymous registration (
GF_USERS_ALLOW_SIGN_UP) and public org creation are disabled.
Modular Docker Compose Blueprint
Below is the sanitized container topology powering the monitoring infrastructure:
# docker-compose.yml — Production Monitoring Stack
services:
  prometheus:
    image: prom/prometheus:v2.53.4
    container_name: monitoring_prometheus
    restart: unless-stopped
    command:
      - --config.file=/etc/prometheus/prometheus.yml
      - --storage.tsdb.path=/prometheus
      - --storage.tsdb.retention.time=30d
      - --storage.tsdb.retention.size=5GB
      - --web.enable-lifecycle
    volumes:
      - ./prometheus/prometheus.yml:/etc/prometheus/prometheus.yml:ro
      - prometheus_data:/prometheus
    networks:
      - monitoring-internal

  node-exporter:
    image: prom/node-exporter:v1.8.2
    container_name: monitoring_node_exporter
    restart: unless-stopped
    command:
      - --path.rootfs=/host
    volumes:
      - /proc:/host/proc:ro
      - /sys:/host/sys:ro
      - /:/host:ro,rslave
    networks:
      - monitoring-internal
    pid: host

  cadvisor:
    image: gcr.io/cadvisor/cadvisor:v0.55.1
    container_name: monitoring_cadvisor
    restart: unless-stopped
    privileged: true
    devices:
      - /dev/kmsg
    volumes:
      - /:/rootfs:ro
      - /var/run:/var/run:ro
      - /sys:/sys:ro
      - /var/lib/docker/:/var/lib/docker:ro
    networks:
      - monitoring-internal

  loki:
    image: grafana/loki:3.5.0
    container_name: monitoring_loki
    restart: unless-stopped
    command: -config.file=/etc/loki/config.yml
    volumes:
      - ./loki/loki-config.yml:/etc/loki/config.yml:ro
      - loki_data:/loki
    networks:
      - monitoring-internal

  promtail:
    image: grafana/promtail:3.5.0
    container_name: monitoring_promtail
    restart: unless-stopped
    command: -config.file=/etc/promtail/config.yml
    volumes:
      - ./promtail/promtail-config.yml:/etc/promtail/config.yml:ro
      - /var/log:/var/log:ro
      - /var/lib/docker/containers:/var/lib/docker/containers:ro
      - /var/run/docker.sock:/var/run/docker.sock:ro
    networks:
      - monitoring-internal

  grafana:
    image: grafana/grafana:11.6.1
    container_name: monitoring_grafana
    restart: unless-stopped
    environment:
      GF_SECURITY_ADMIN_USER: ${GRAFANA_ADMIN_USER:-admin}
      GF_SECURITY_ADMIN_PASSWORD: ${GRAFANA_ADMIN_PASSWORD}
      GF_USERS_ALLOW_SIGN_UP: "false"
      GF_USERS_ALLOW_ORG_CREATE: "false"
    volumes:
      - grafana_data:/var/lib/grafana
    networks:
      - monitoring-internal
      - traefik-public
    labels:
      - traefik.enable=true
      - traefik.http.routers.grafana.rule=Host(`monitoring.example.com`)
      - traefik.http.routers.grafana.tls.certresolver=letsencrypt

volumes:
  prometheus_data:
  loki_data:
  grafana_data:

networks:
  monitoring-internal:
    external: true
  traefik-public:
    external: true
Join the conversation
Have thoughts on this post? Share them on social media or reach out directly.